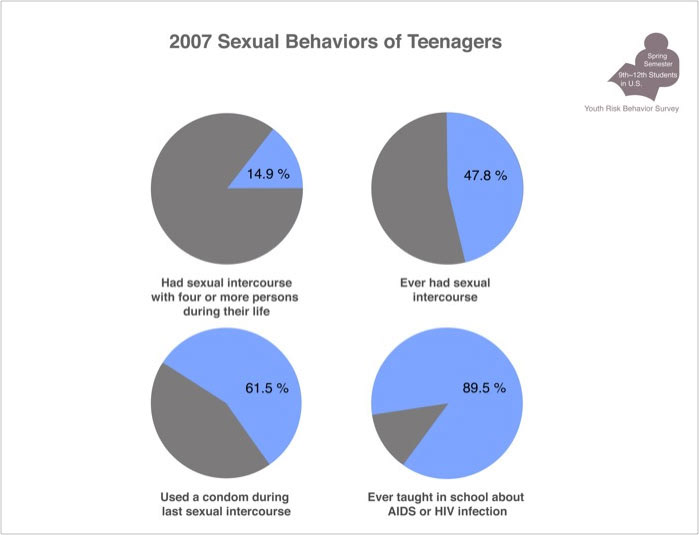
Considering balance, I wanted to achieve symmetry in Sexual Behaviors of Teenagers (2007) visualization.
The title and a frame containing 4 charts and texts are center aligned,
and each chart and text sits in the grid except for the ‘student ‘ icon.
I pursued creativity in storytelling.
I chose 4 data points related to sexual behaviors of teenagers:
Ever had sexual intercourse (14.9%),
Had sexual intercourse with four or more persons during their life(47.8%),
Used a condom during last sexual intercourse(61.5%),
Ever taught in school about AIDS or HIV infection (89.5%).
The four data points show various percentages and provide new possible narratives and hypotheses
which can lead to new research questions.
For example, I can create a story and a question:
Almost 50% of students have sexual intercourse and about 60% of students use a condom
even though most of them are taught in school about AIDS or HIV infection,
What data will be changed, if the percentage of AIDS education is dropped to 50%?